
Having used PlantUML frequently over the last 5 years, I don’t hesitate to spread the word about this amazing tool. I recently gave a talk about this in JPMorgan. The following’s the written version of it.
Let’s start with the problem PlantUML is trying to solve: when we use diagram tools like Microsoft Visio, Gliffy or Excalidraw, we have to layout every single box and manually connect their vertices with arrows by ourselves. Say we have an architecture diagram for our software. Halfway through the product life cycle, we will have ourselves a decently complex diagram with several components. If for some reason there’s a product direction change and we have to remove a component, what does that look like? We have to delete that component, re-connect all the arrows, and essentially, all its surrounding objects need to be changed. If you’re like me and are pedantic about the number of tiny-little grid squares that each box is supposed to occupy, it can soon become a time consuming process to make sure everything look nice.
That’s where PlantUML comes in. It’s an open-source tool that converts plain text markup into diagrams. It takes care of the drawing and the layout for you. And if you have to edit the diagram, you just need to adjust the markup. No more manual layout adjustments.
You don’t need to be a full-time engineer to create these diagrams. Most of the text you write would be the content you see on the diagram itself, which you would have had to do if you chose another tool anyway.
To be fair, the tool doesn’t give out the best first impression. The color choices, the official website design, and their online demo server look straight out of the 2000s era. But I urge you to give it five minutes because the tool is highly customizable (colors included) and supports a variety of diagram types.
I use the tool mostly to draw sequence diagrams. Sequence diagrams are used to depict relationships between components in your architecture.
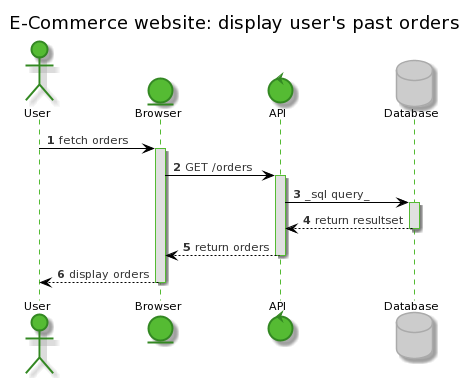
The following is an example of a simple sequence diagram. The scenario is that a user wants to display their past orders on an e-commerce website.
1
2
3
4
5
6
7
8
9
10
11
12
13
14
15
16
17
18
19
20
21
@startuml
!define LIGHTGREEN
!includeurl https://raw.githubusercontent.com/Drakemor/RedDress-PlantUML/master/style.puml

actor User as U
entity Browser as B
control API as A
database Database as D

autoactivate on
autonumber

title "E-Commerce website: display user's past orders"

U -> B: fetch orders
B -> A: GET /orders
A -> D: _sql query_
D --> A: return resultset
A --> B: return orders
B --> U: display orders
@enduml
The above text generates the following diagram.
You can try it out yourself. Go ahead and paste this link in PlantUML’s free online server. An even better alternative is to install the PlantUML plugin which is available for every popular IDE/code editor out there.
Shout out to @Drakemor for this pleasant palette. It speaks to PlantUML’s style customizability.
The most useful feature in my opinion, is that developers are now enabled to check-in this diagram to source code. You can either store the markup along with the class that’s implementing the diagram or simply add the encoded URL to your Javadoc / JSDoc comment.
To find out about other sequence diagram features or about other diagram types, you don’t need to look any further than the comprehensive documentation on the official website. But these two resources also serve as excellent sources of inspiration for different diagrams and their use cases: PlantText and Real World PlantUML. All the above resources contain real-world usages along with the markup needed to generate the diagram, which are a great way to kick-start your own diagrams.
Once you get proficient with this tool, an advanced use case I can think of and one I’m personally planning to try out, is to give educational presentations starting with a blank slate. For instance, you could explain the different moving parts of an architecture, by slowly introducing new components and connecting them by adding markup and letting the PlantUML engine generate the diagram as you talk through them.
With remote work here to stay, there’s a need for a good replacement for physical whiteboards. The existing drawing tools, for the reasons mentioned above, just don’t work for me. I’m looking forward to trying out PlantUML for some solution engineering whiteboarding sessions.